
R&D Expenditures in Russia and in the World’s Leading Countries
In 2015 Russia’s Internal R&D expenditures amounted to 914,7 billion roubles, with annual growth rate of 0,2% (in constant prices), or to 1,13% of GDP. The new issue in the “Science, Technology and Innovation” series compares internal R&D expenditures in Russia and in the leading countries of the world in 1995–2015.
The information bulletin is based on Rosstat, OECD (OECD.Stat), UNESCO (UIS.Stat), Eurostat data and HSE ISSEK calculations.
Printed version (in Russian): R&D Expenditures in Russia and the World’s Leading Countries
Russia’s internal R&D expenditures in 2015 have reached 914,7 billion roubles, or 40,5 billion USD (in purchasing power parity terms). Russia is the world’s 9th biggest R&D spender, after the US, China, Japan, Germany, Republic of Korea, France, India, and the UK (figure 1).
Figure 1. Twenty countries – leaders in R&D expenditures: 20151 (billion USD, in national currencies’ purchasing power parity terms)
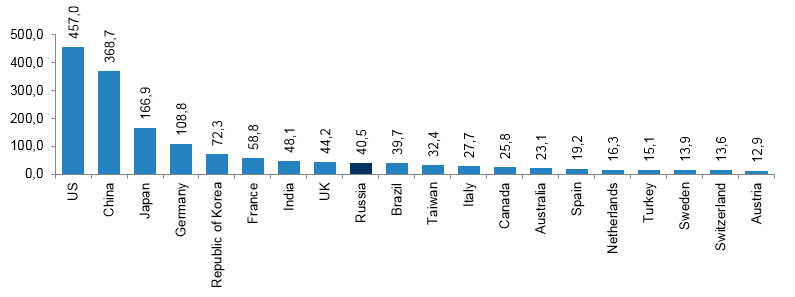
1Or the nearest years for which data is available
Compared with 1995, Russia has slightly improved its position in the world’s leading R&D spenders ranking, moving up from the 10th to the 9th place. China’s progress was much more significant, rising from the 7th to the 2nd place due to annually growing R&D expenditures (on average by 17,1%). Accordingly, Japan has moved down from the 2nd to the 3rd place, and Germany – from the 3rd to the 4th.
Republic of Korea (with internal R&D expenditures’ average annual growth rate during the period in question of 8,1%) has improved its ranking, moving up ahead of France (the 6th place) and the UK (the 8th). Other countries – former members of the ten biggest R&D spenders in purchasing power parity terms have lost their positions (namely Italy and Canada). India (only data for 2011 is available) in terms of absolute R&D expenditures is ahead of the UK and Russia.
R&D expenditures growth in Russia during the previous two decades was the same as in the world’s leading economies: in 1995–2015 internal R&D expenditures in Russia grew 2,6 times (in constant prices), while combined R&D expenditures of the OECD member countries in 1995–2014 grew 1,8 times, and in EU28 — 1,7 times. Note that certain countries, including emerging economies, display more impressive dynamics: e.g. China during the same period has increased its R&D expenditures 19,9 times (in constant prices), Republic of Korea — 4,4 times, Israel— 3,4 times. To compare: the relevant figure in the US was 1,7 times, and in Japan — 1,6 times.
In terms of R&D expenditures as a share of GDP, Russia significantly lags behind the world’s leading nations (at the 34th place in the ranking) (figure 2). The five leaders are Republic of Korea (4,29%), Israel (4,11%), Japan (3,59%), Finland (3,17%), and Sweden (3,16%).
Figure 2. Internal R&D expenditures as a share of GDP (%), by country: 20151
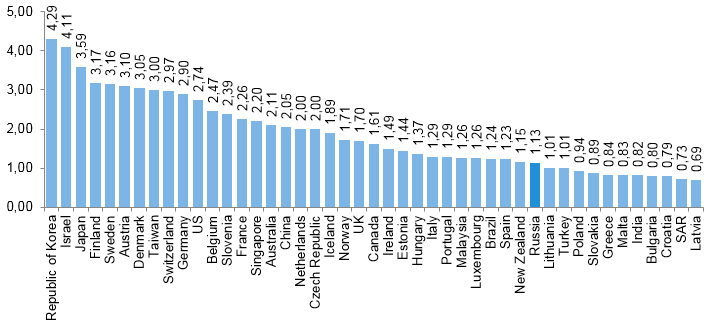
1Or the nearest years for which data is available
Internal R&D expenditures as a share of GDP increased both for all OECD member countries taken together (from 1,99% in 1995 to 2,38% in 2014), and for EU28 (from 1,60 to 1,95%) (figure 3). A significant (more than 1,4 percentage points) growth of this indicator was noted in Republic of Korea (2,09%), Israel (1,66%), Austria(1,56%), and China (1,48%). In Russia it grew from 0,85% in 1995 to 1,13% in 2015.
Figure 3. Growth of internal R&D expenditures as a share of GDP: 1995–2015
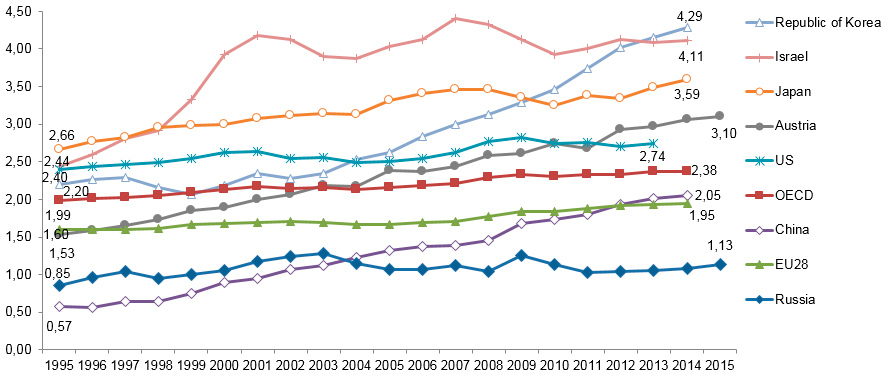
Until 2004 Russia was ahead of China in terms of overall internal R&D expenditures; after that the relevant figure in China became higher than in Russia, and now (at 2,05% in 2014) is comparable with those for Australia (2,11%) and Singapore (2,20%).
All issues (in Russian)