
Online Nowcasting
One needs statistics to assess current state and possible development trends of the economy, which usually become available only after a certain lag. Possible approaches to quickly and accurately monitor the ever-changing economic situation were discussed at the CIRET conference, where the Higher School of Economics was represented by Tamara Lipkind, leading expert at HSE ISSEK Centre for Business Tendency Studies.
| The Centre for International Research on Economic Tendency Surveys (CIRET) is a recognised venue for sharing experience and knowledge between academic community and practitioners specialising in consumer and business surveys. CIRET experts regularly come together to discuss results of latest research, relevant techniques, and approaches to quantification and analysis of the studies’ results. Every two years CIRET hosts international conference “Economic Tendency Surveys and Economic Policy”. The most recent (33rd) one took place in September in Copenhagen (Denmark), hosted jointly by the KOF Swiss Economic Institute, the Getulio Vargas Foundation (Brazil), and Statistics Denmark. CIRET is headquartered in Zurich (Switzerland). |
Nowcasting is coming into vogue
Nowcasting is a relatively new economic term which implies analysing various indicators for real-time short-term forecasting purposes.
This concept was suggested by Lucrezia Reiclin of the London Business School, who applied a meteorological term to economics. Unlike meteorologists who make weather forecast for a coming period, economists have to not only forecast the immediate future but also assess the current state and the recent situation (and regularly adjust their assessments). Since key statistical indicators (such as, e.g., GDP) become available only after a significant lag (and are repeatedly reviewed subsequently), there’s practically no reliable data about the actual state of economic affairs at any given time.
There’s nothing unusual about short-term forecasts of this kind as such – experts have always been making them based on their personal opinions and judgements. However, nowcasting tools allow to automate this process and make it more impartial. Quite complex statistical models are applied to achieve that, processing large volumes of up-to-date data, producing forecasts for key economic variables, and updating them as the data changes.
E.g. more frequently collected, or open-sources data is used in nowcasting to assess key economic indicators normally calculated with a significant lag. Taken together, such up-to-date data can provide “early warning” signals about actual or expected changes of the targeted economic indicator. Such forecasts can be automatically updated at any time, and allow to know exactly which newly available information has changed the forecast, and exactly how it did so.
Since nowcasting models merge large volumes of data coming from various sources at various frequency rates, further development of this methodology is concentrated on several aspects. How do we avoid the “curse of dimensionality” without losing sight of important data? How do we deal with the so-called “jagged edge” issue arising due to mismatched data publication timeframes? Would it be possible to improve the statistical models used for nowcasting purposes by including business tendency surveys’ data?
These issues were addressed in the keynote report by Professor Soren Johansen (University of Copenhagen), and in presentations by Professor Michael Graff (Swiss Economic Institute), Professor Kevin Lee (University of Nottingham), Christian Hepenstrick (Swiss National Bank), Scott Brave (Federal Reserve Bank of Chicago), and others.
Comparing various nowcasting techniques, most of the researchers agreed that dynamic factor models were most efficient, especially their extended modifications. Introduction of business tendency surveys’ results (which normally become available much earlier than “hard” statistics, and frequently offer forward-oriented information) increases reliability of assessments.
|
Statistical theory commonly uses such terms as “hard” and “soft” data. Hard data includes quantitative information collected by statistical services and measured in physical (tons, units, etc.) or monetary (e.g. roubles) units. Soft (qualitative) data comprises results of company management, general population, or expert surveys; opinions of the latter are used in combination with various quantification techniques. Such statistics normally become available ahead of hard data, and supplement it – by providing insights on economic aspects which quantitative statistics cannot measure (e.g. entrepreneurial or consumer expectations). |
Soft data analysis is starting to play a more important role
The conference also addressed traditional issues of improving business tendency surveys’ methodology, designing composite and forward-oriented indicators, analysing their cyclic behaviour, and applying the results.
Business tendency surveys may serve as a reliable tool for measuring economic uncertainty, noted Roberta Fritz (an expert with the European Commission); in his presentation he described efficiency of various economic uncertainty indicators based on quantification of entrepreneurial expectations.
A curious psychological aspect was presented by Gerhard Schwarz of the Austrian Institute of Economic Research. Why respondents often tend to ignore surveys? Does the degree the questionnaire is filled depend on the time the electronic query was sent? The author’s hypothesis that queries sent in the morning would be accepted by the well-rested entrepreneurs more enthusiastically, was confirmed only in the case of an industrialists’ survey. Representatives of other industries may see surveys not as a “reporting load” but as relief from their main work; in that case it would make sense to try and make questionnaires more user-friendly, deliberated Dr Schwarz.
Taking behaviour models into account
The report “Clustering entrepreneurial assessments of small retail business development in Russia” by Liudmila Kitrar, Inna Lola, Tamara Lipkind, Georgy Ostapkovich, and Dmitry Chusovlyanov (HSE ISSEK) presented a tested technique for analysing the so-called “behavioural models” based on cluster analysis.
Respondents’ answers are normally aggregated into statistical balances (to better interpret the results of qualitative surveys), which are then used to build composite indicators. However, this is not the only way to quantify information – it can and should be supplemented with other techniques. Specifically, application of cluster analysis allows to analyse statistical distribution of individual answers (with traditional aggregation, this information gets lost). Also this approach opens an opportunity to observe dynamics of respondents’ “neutral” answers – which usually have a prevailing share in the distribution, but are not taken into account when balances and composite indicators are calculated.
This technique is especially useful at the times of possible turning points in the business cycle, when companies’ reaction to actual or perceived economic developments must be carefully studied. E.g. having compared behaviour patterns during the two most recent recessions, the researchers concluded entrepreneurs were much more pessimistic at the end of 2014 than in 2009 (see figure 1).
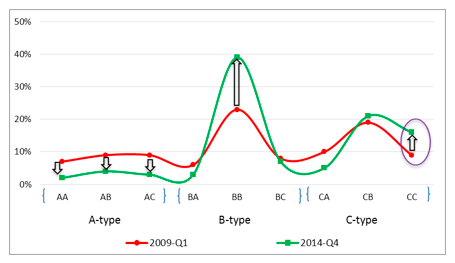
Figure 1. Behaviour patterns in the I quarter of 2009 and the IV quarter of 2014.
In 2014 fewer companies were included in high trade potential groups (AA, AB, and AC in the figure) based on cluster analysis results; some of them moved on to medium potential groups (ВА, ВВ, and ВС), and others – to lower potential ones (СА, СВ, and СС). The most telling change was the doubling of the number of companies in group СС: their managers not only negatively assessed the current state of their business but expected it to deteriorate even further.
Since entrepreneurs’ opinions and expectations can serve as a quite accurate barometer of economic trends, the results of the analysis indicated that further deepening of the recession should be expected in 2015 (which has actually happened in reality).
Text by Tamara Lipkind